PROFESSIONAL · PORTFOLIO

Real engagements, already delivered.

Six anonymized case studies drawn from delivered data-engineering, analytics and automation work. Names, sites and identifying numbers removed; methods and outcomes are real.

01
The REDCap platform beside a national TB active case-finding session in the field.
National-scale TB active case-finding — five REDCap databases unified into one reporting view.
Screening cascade: 494,400 screened, 122,400 eligible, 105,646 diagnostic results.
The screening cascade against programme targets, built from the unified dataset.
Public health — national-scale TB active case-finding data platform
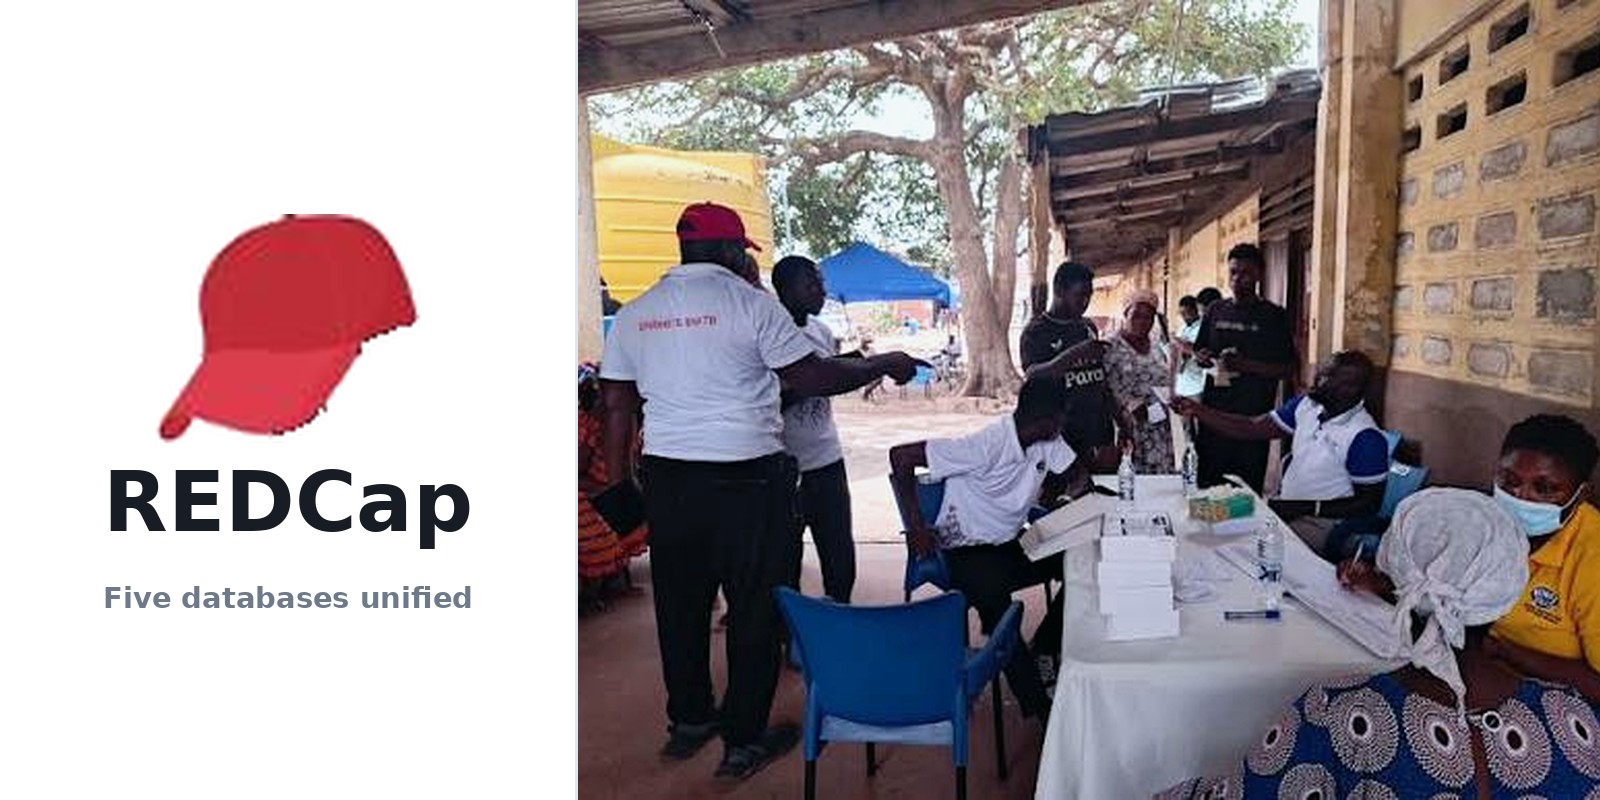
National-scale TB screening data platform: five REDCap databases unified into one reporting system

Goal — one trustworthy, near-real-time view of a half-million-person screening campaign

A large tuberculosis active-case-finding campaign in Cameroon screens community members, primary-health facilities and prisons across seven regions, capturing data in five separate REDCap databases plus several external laboratory and programme systems.

The problem

Data for the same participant was fragmented across five REDCap projects with dual and quadruple QR-code identifiers, bilingual French/English forms, and external GeneXpert, treatment-outcome and national-programme feeds — making reliable, timely reporting almost impossible.

What I did

I built a three-stage Python pipeline (import → process → report) with an ID-validation engine that regex-checks and repairs every QR code, links screening to specimen to laboratory result, normalises bilingual fields, extracts spirometry metrics from PDFs, and integrates four external data sources — orchestrated hourly through Airflow.

494,400
People-screened target
5 REDCap DBs
Unified into one system
7 regions
Coverage across Cameroon
~13 min
Incremental data refresh
public-healthtuberculosisREDCapdata-pipelineAirflowPython / Polars
Result

The programme now runs on a single unified participant dataset refreshed automatically through the day, turning five disconnected databases and dozens of raw exports into analysis-ready reporting on screening, eligibility and diagnostic results.

02
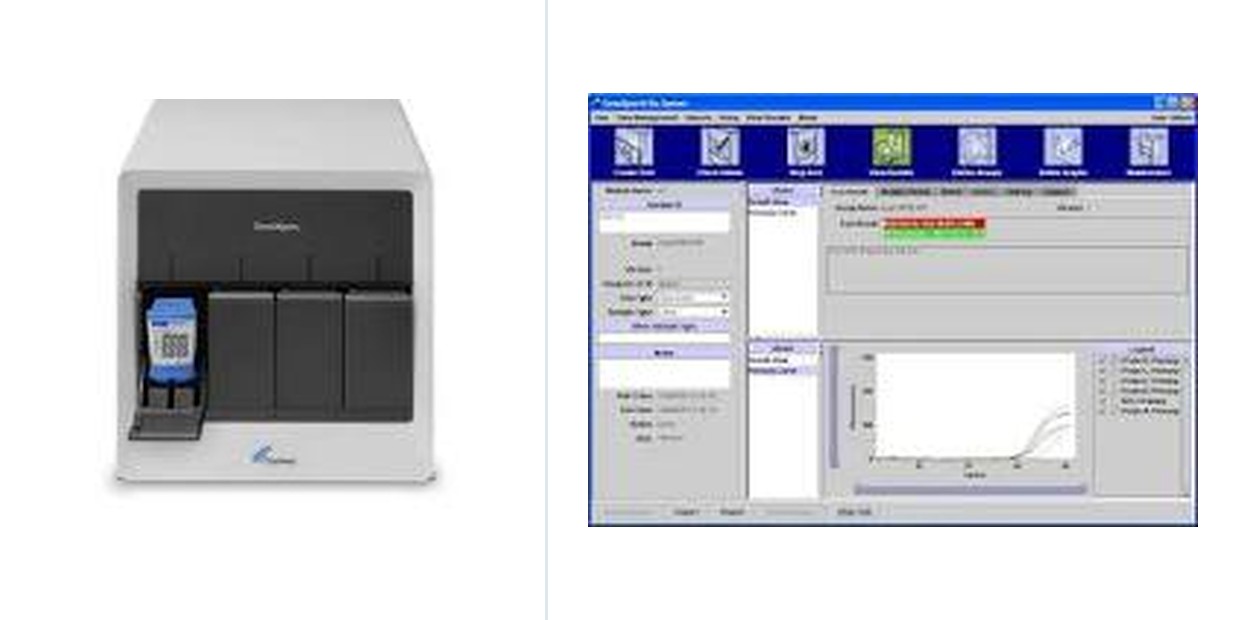
A GeneXpert instrument beside its results software — the raw exports behind the ETL pipeline.
The GeneXpert instrument and its results software — roughly 1,700 raw files per run turned into one clean result table.
Diagnostics data engineering — molecular TB testing (GeneXpert MTB/RIF)

GeneXpert MTB/RIF results ETL and pooled-testing analytics

Goal — turn messy, multi-encoding instrument exports into one clean, analysis-ready result set

GeneXpert molecular testing machines across seventeen Cameroon laboratories export raw CSV result files that vary by language and character encoding, feeding several TB research studies and a diagnostic-efficiency manuscript.

The problem

Raw exports varied by machine language (English/French) and encoding (UTF-16-LE, UTF-8-SIG, windows-1252, latin-1), study IDs were malformed or hand-typed, pooled testing produced duplicate sample records, and tests spanning midnight produced invalid negative durations.

What I did

I built a high-performance parser with a BOM-plus-chardet encoding cascade and a process-pool that auto-switches to streaming above ten thousand files, then a cleaning layer that applies 200+ French→English mappings, extracts study IDs by project-specific regex, corrects datetime rollovers, and resolves pooled cartridges back to individual specimens.

1,721 files
Parsed per scheduled run
133,556 rows
Consolidated result set
17 labs
Laboratories consolidated
77.5 / 84.3 min
Median time-to-result (pos/neg)
ETL pipelineGeneXpert / TB diagnosticsencoding detectionPython / Polarspooled testingbiostatistics
Result

A single automated run consolidates 1,721 raw machine exports into a 133,556-row analysis-ready dataset, and a pooled-testing analysis across 14,404 pools quantified where pooling saves cartridges without missing cases.

03
TB treatment medication and a treatment-monitoring consultation.
Reconnecting every TB treatment record to its original enrolment across six research cohorts.
Clinical research data engineering — record linkage for treatment outcomes

Probabilistic record linkage: reconnecting TB treatment records to their original enrolment

Goal — make sure every patient on treatment is linked back to their screening record

Tuberculosis treatment records arrive in a separate clinical database and often lack the unique participant IDs used across six research cohorts, breaking the link between a patient's treatment and their original enrolment.

The problem

Without a shared identifier, manual reconciliation of treatment records against six studies was slow, error-prone and unscalable, leaving treatment outcomes disconnected from enrolment and screening data.

What I did

I built a two-stage probabilistic matcher — exact phone-hash lookup, then a demographic fuzzy match (rapidfuzz on names, filtered by age and gender) with weighted scoring — that reconciles treatment records to the right participant and syncs the result back to the central outcome database, with national-programme target tracking on top.

6 cohorts
Consolidated and matched
2-stage
Phone + fuzzy demographic match
0.80
Match-confidence threshold
Hourly
Automated Airflow refresh
record-linkagerapidfuzzREDCapAirflowPower BIPython
Result

Treatment records are now linked automatically to their enrolment records and written back to the central database, and three Power BI dashboards track treatment progress against national-programme targets by site and region.

04
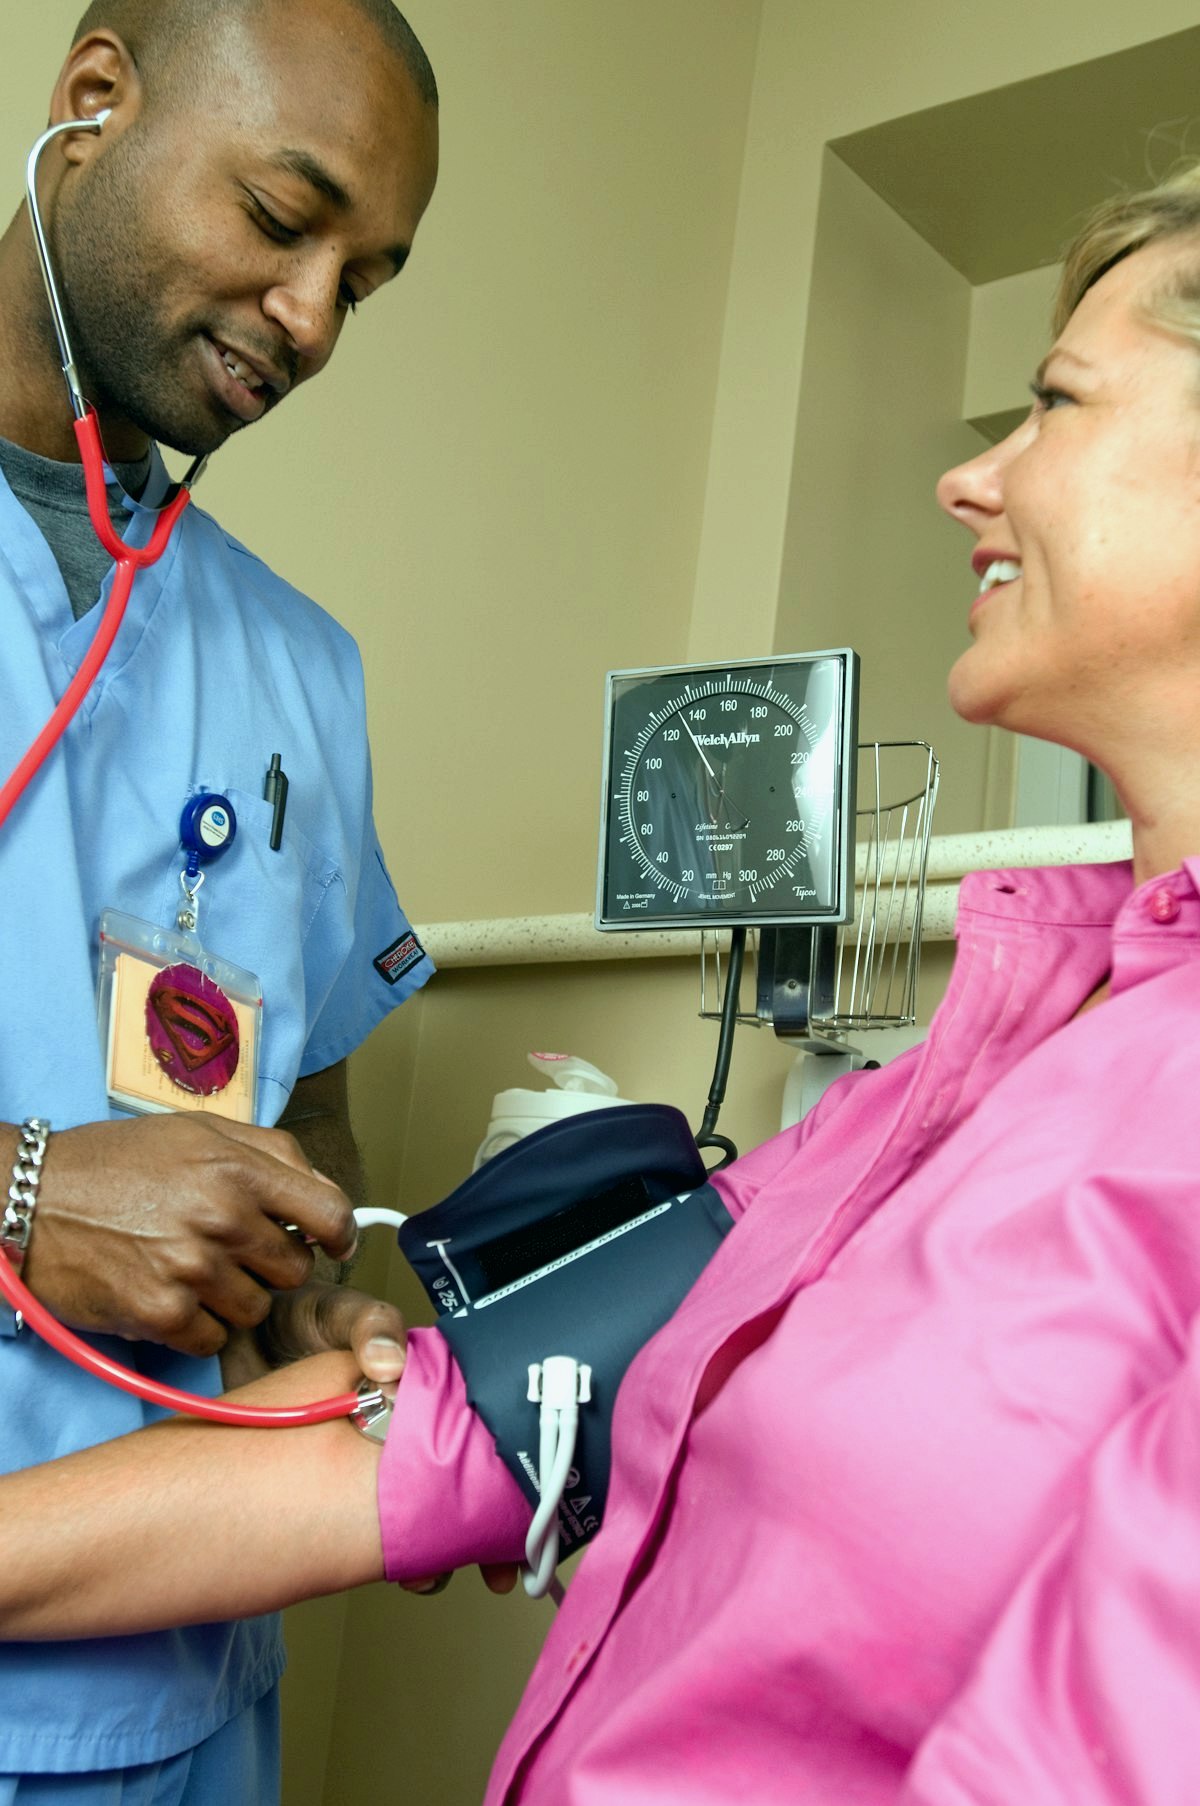
A health worker performing a point-of-care check at a community health centre.
Near point-of-care TB testing at community health centres — field dumps to clean, quality-scored records (representative photo).
Clinical data engineering — near point-of-care TB testing pipeline

Near point-of-care TB testing: an automated dump-to-REDCap pipeline with built-in data-quality scoring

Goal — reliable, continuously quality-checked field data from community testing sites

A near point-of-care TB testing study at community health centres collects QR-coded field data across screening, specimen and laboratory forms that must be reconciled into three clinical databases and monitored against a study protocol.

The problem

Field testing generates messy, duplicate-prone data dumps spread across many forms and sites, with no automatic way to catch quality problems or track progress against per-site testing targets.

What I did

I built an end-to-end pipeline that deduplicates and uploads field dumps into three REDCap projects (thirteen forms), then runs a configurable data-quality engine that scores records on multiple dimensions, persists query lifetimes, and builds region-aware daily and monthly testing targets using a working-day calendar with Cameroon public holidays.

3 REDCap projects
Orchestrated from one pipeline
13 forms
Screening, specimen & lab
8 test types
Across 3 diagnostic categories
4-level
Data-quality priority taxonomy
data-qualityREDCapdeduplicationschedulingSQLitePython
Result

Field data flows from collection to clean, quality-scored REDCap records automatically, with daily tracking reports and per-site targets that let the study monitor testing coverage and data quality in near-real time.

05
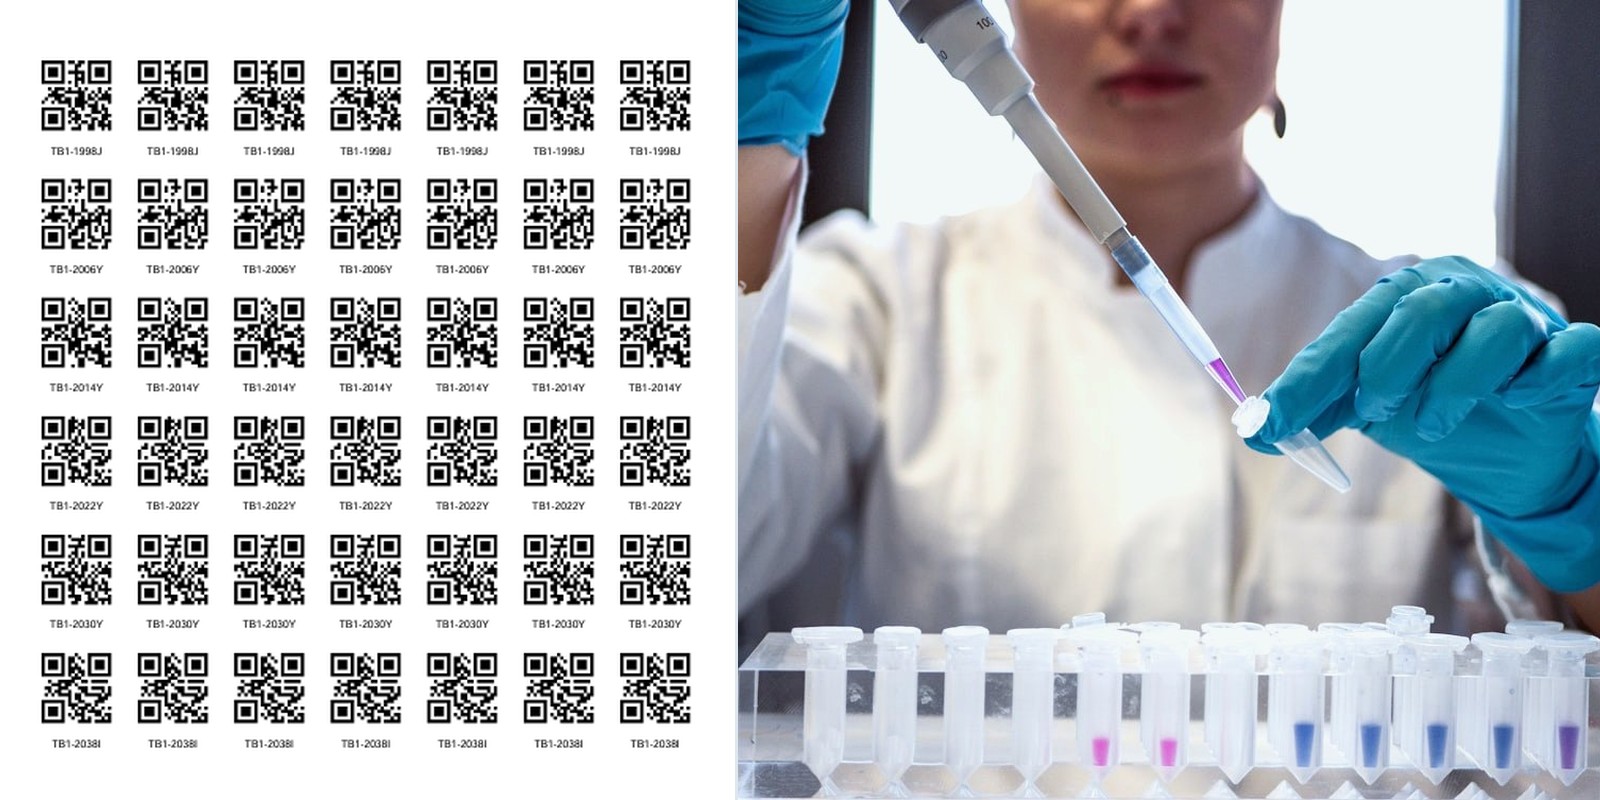
A sheet of generated participant QR codes beside specimen handling in the laboratory.
Generated QR identities for every participant and specimen — from the field to the laboratory bench.
Field operations / research data systems — identity & specimen tracking

Million-scale QR identity and specimen-tracking system

Goal — give every participant and specimen a unique, scannable, collision-free identity

Across a multi-region TB programme in Cameroon, participants and specimens must be identified and matched reliably from enrolment in the field all the way through to the laboratory bench, by a distributed team working in parallel.

The problem

Hand-written and re-typed IDs caused mismatches and duplicate entries, and a distributed team generating labels in parallel risked number collisions across hundreds of sites.

What I did

I built a QR-rendering engine (reportlab/qrcode) that lays unique, site-formatted codes into print-ready PDF sheets, backed by a file-locked, multi-user auto-increment counter so concurrent operators never collide, plus a Microsoft Graph reconciliation script that matches generated codes against site usage and study data.

~2.04M codes
Generated cumulatively
371 sites
Tracked in the shared counter
3,742 sheets
Print-ready PDF batches
10 regions
Covered across Cameroon
PythonqrcodereportlabSharePoint / Graphfile-lockingfield data
Result

Scanning replaced manual ID entry across hundreds of sites, the shared counter eliminated number collisions for a distributed team, and roughly two million traceable codes were issued and reconciled against study records.

06
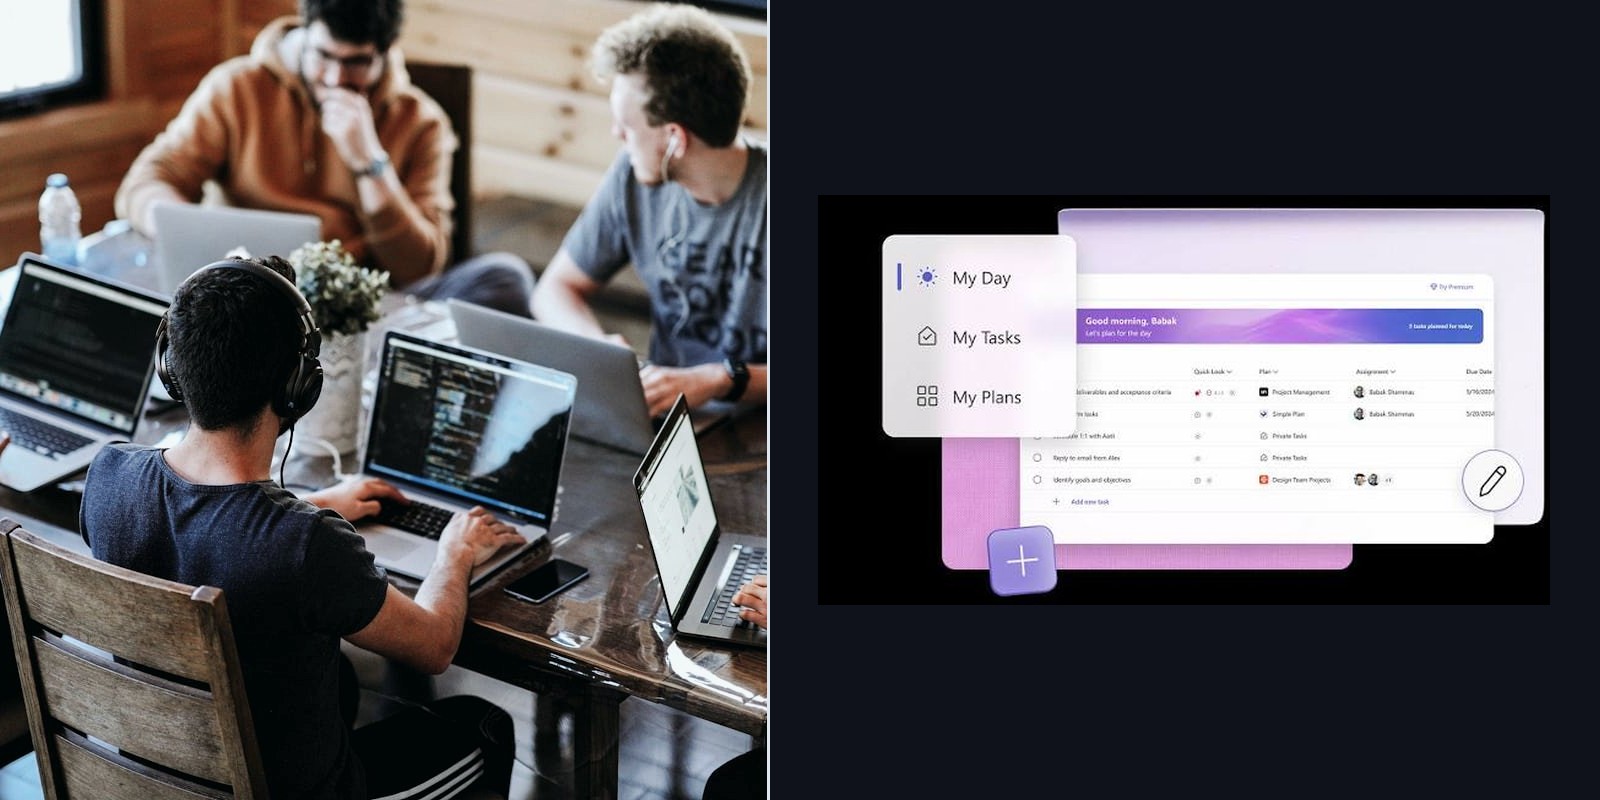
The delivery team at work beside the Microsoft Planner board behind the automated digest.
Automated daily Microsoft Teams digests of operational progress, drawn from six Planner plans.
Operations automation — Microsoft 365, Planner & Teams

Microsoft Planner → Teams operational-reporting automation

Goal — give the team automatic, timely visibility of operational progress

A public-health data team tracks its operational plan across six Microsoft Planner plans, where manually compiling progress was slow and updates rarely reached the right people in time.

The problem

Tracking progress across six plans by hand was slow, and completed work was not surfaced to the team promptly, so blockers and achievements went unnoticed.

What I did

I built a Microsoft Graph automation that delta-extracts tasks across six plans, cleans them to one row per assignee, and posts a daily Microsoft Teams digest of work completed in the last 24 hours — with an emoji progress chart, an HTML summary table and proper @mentions — while keeping a SharePoint master site list in sync.

6 plans
Tracked automatically
24 h
Rolling completion digest
Auto @mentions
Right people notified
SharePoint
Master list kept in sync
Microsoft GraphPlannerTeamsMSALSharePointautomation
Result

Operational reporting that used to be manual now runs by itself: the team gets a timely, readable Teams digest of completed work each day, and the master site list stays continuously in sync.

LET'S TALK

Ready to get started?

Tell me about your project, question or goal. I reply within 24 hours, in English or French.

Get in touch