A selection of dissertation analyses I've supported — student names and institutions removed; subject areas, methods and results are real.
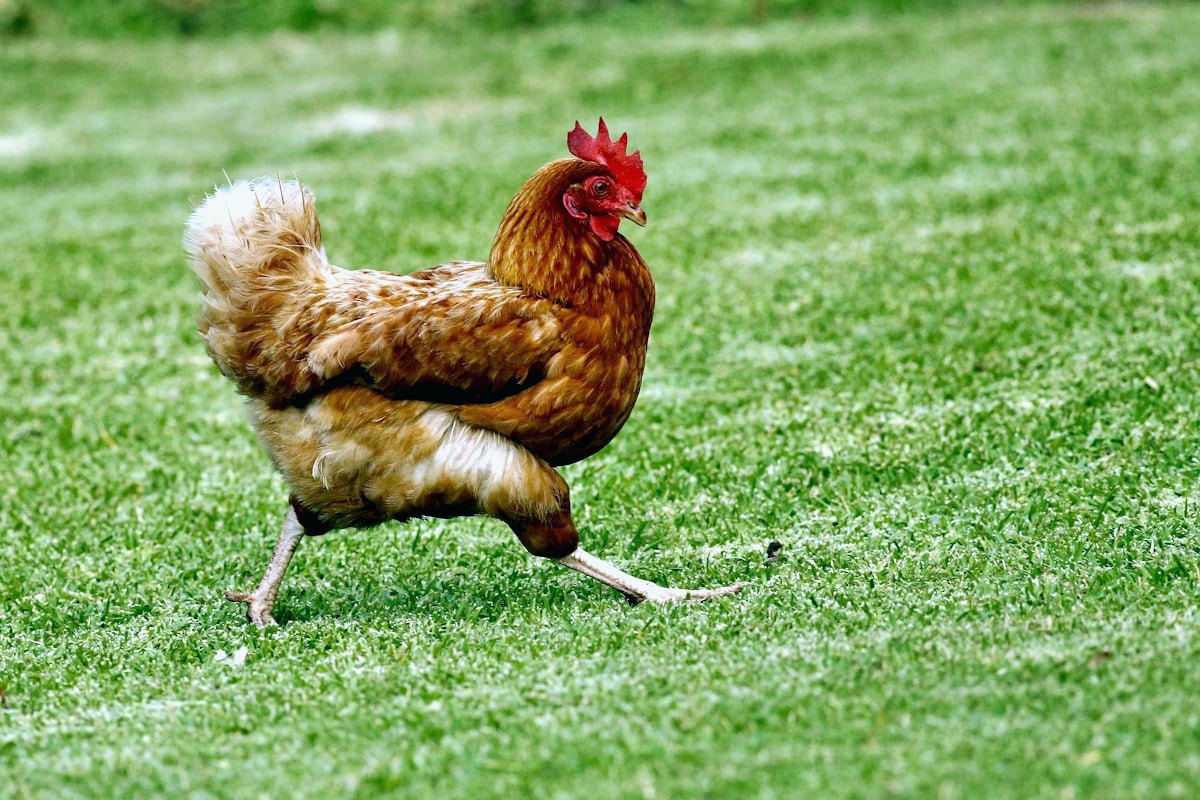
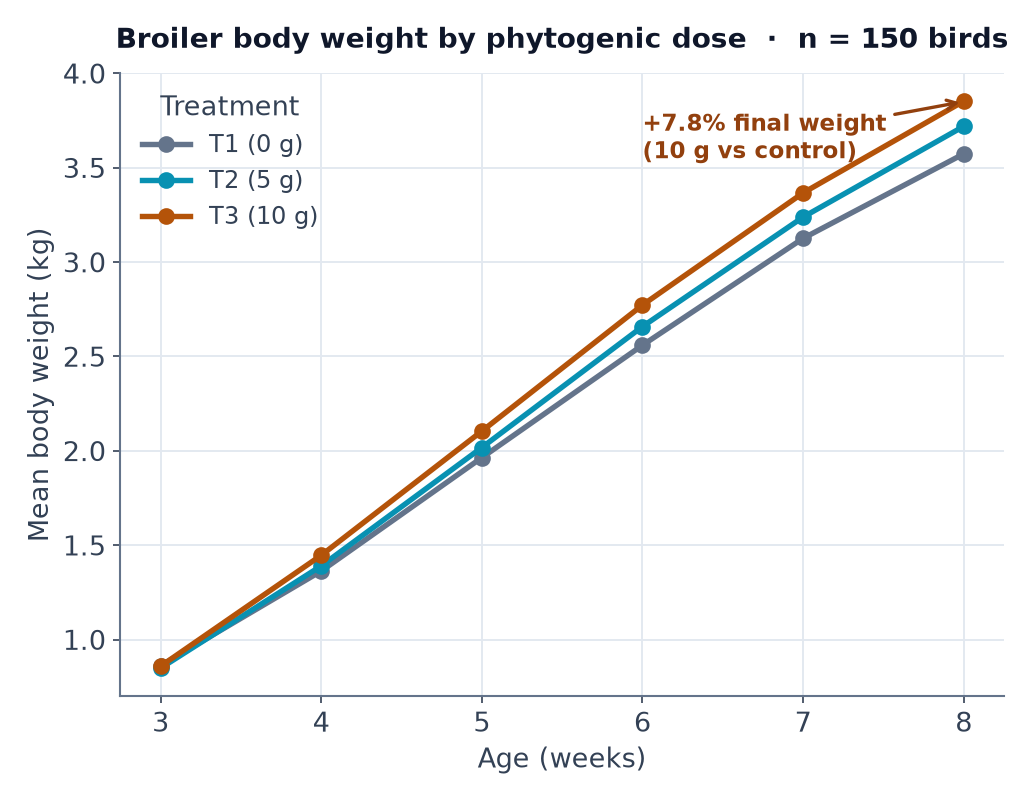
01Smallholder broilers like those in the feeding trial (representative photo).Weekly body weight by dose: the 10 g/kg group pulls ahead from week 5, reaching +7.8% by week 8.
Animal science — poultry nutrition and experimental design
Phytogenic feed additive trial: does bitter leaf juice improve broiler growth?
Goal — Prove a phytogenic additive's dose-response effect with rigorous statistics
A controlled feeding trial in the North-West Cameroon highlands tested bitter leaf (Vernonia amygdalina) juice as a natural, locally available alternative to antibiotic growth promoters for smallholder broiler farmers. The study followed 150 three-week-old chicks under typical open-sided housing conditions over five weeks.
The problem
The raw weekly records for 150 birds across six observation points had to be turned into a defensible answer to two questions: does the additive improve growth, feed efficiency and health, and is the effect dose-dependent? This required a complete statistical analysis robust enough for a dissertation defence.
What I did
I structured the data from a Completely Randomised Design (three doses: 0, 5, 10 g/kg; 50 birds each) and ran a full analysis pipeline in SPSS and Python: one-way ANOVA per outcome, Tukey HSD post-hoc, multiple linear (OLS) regression on body weight, a chi-square test on mortality and a Pearson correlation matrix, all at alpha = 0.05.
Final body weight rose dose-dependently from 3.57 kg (control) to 3.85 kg at 10 g/kg (+7.8%, ANOVA F = 29.56, p < 0.0001), with FCR improving 14.5% and every Tukey pairwise contrast significant. The regression explained 98.2% of weight variation (R-squared = 0.982) and isolated a treatment-specific gain of 0.179 kg at the high dose; mortality fell from 6.0% to 2.0% in treated groups (directional, not significant at p = 0.4371).
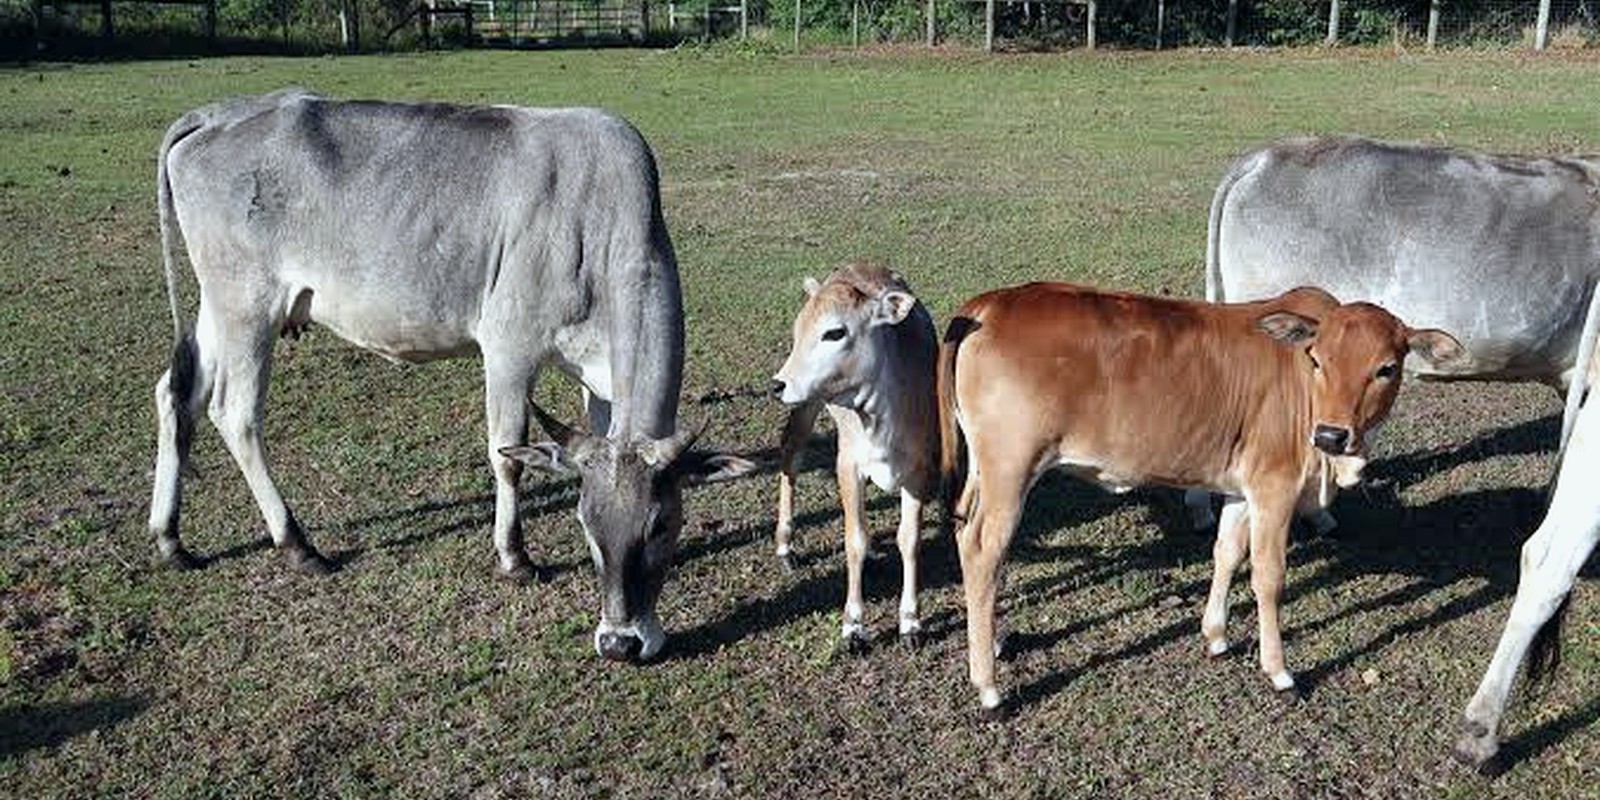
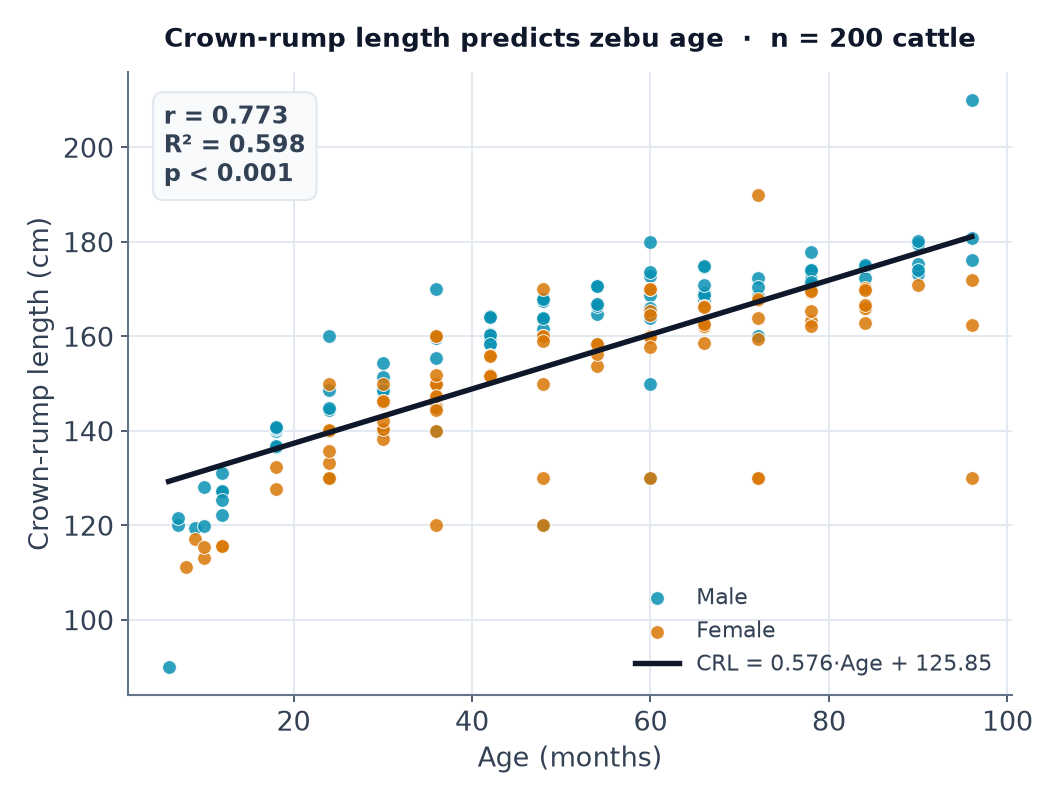
02Zebu cattle of the type measured in the study — a single crown-rump tape measurement predicts age.Crown-rump length vs age (n = 200): CRL = 0.576 × Age + 125.85 (r = 0.773, R² = 0.598, p < 0.001).
Animal science / morphometrics
Predicting zebu cattle age from a single tape measurement
Goal — Build a simple field tool to estimate cattle age from one tape measurement.
In extensive pastoral systems of the Bamenda highlands (North-West Cameroon), zebu cattle birth dates are rarely recorded, so age must be estimated by skilled dentition reading, a method that buyers and traders cannot easily apply at market.
The problem
The client needed to test whether a simple, non-invasive body measurement (crown-rump length) could serve as a reliable field proxy for age, and to quantify that relationship while accounting for sex and breed.
What I did
Crown-rump length and dentition-estimated age were recorded for 200 zebu cattle across four breeds, then analysed with descriptive statistics, Pearson and Spearman correlation, simple linear regression, a Welch independent-samples t-test and one-way ANOVA at the 5% significance level.
Age and crown-rump length showed a strong, highly significant positive relationship (r = 0.773, p < 0.001), with age explaining 59.8% of length variation, yielding the field equation CRL = 0.576 × Age(months) + 125.85; males were significantly longer than females (p = 0.018) while breeds did not differ significantly (p = 0.060).
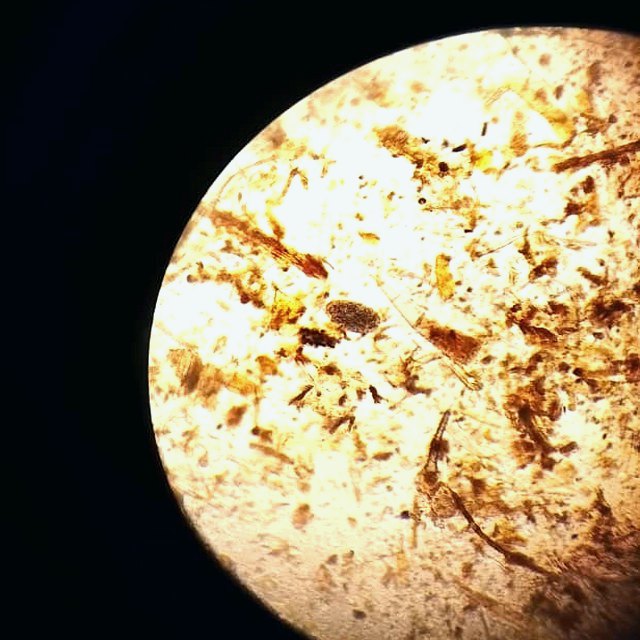
03A real photo from the study: examining faecal-floatation slides under the microscope.A real faecal-floatation field under the microscope — the bench reality behind the numbers.
Veterinary parasitology — epidemiological survey and statistical analysis
Gastrointestinal Worm Prevalence Survey in Small Ruminants by Faecal Microscopy
Goal — Quantify worm prevalence and target deworming
A cross-sectional study of gastrointestinal helminth infection in sheep and goats raised in a peri-urban municipality of the Bamenda highlands, North-West Cameroon, where communal grazing and high humidity favour worm transmission.
The problem
Locality-specific prevalence data had been absent for over a decade, leaving farmers and veterinary services without an evidence base to target deworming and gauge which worm genera and host groups drive infection.
What I did
200 faecal samples were examined by saturated-salt floatation and sedimentation microscopy, then tabulated by parasite genus, sex and age, with chi-square tests of independence (SPSS) to assess associations between infection status and host factors.
Overall prevalence was 32.0% (64/200), dominated by Trichostrongylus spp. (27.0%); infection was strongly associated with age (adults 41.4% vs young 10.0%, chi-square = 19.07, p < 0.001) but not with sex (37.0% vs 27.0%, chi-square = 2.30, p = 0.130).
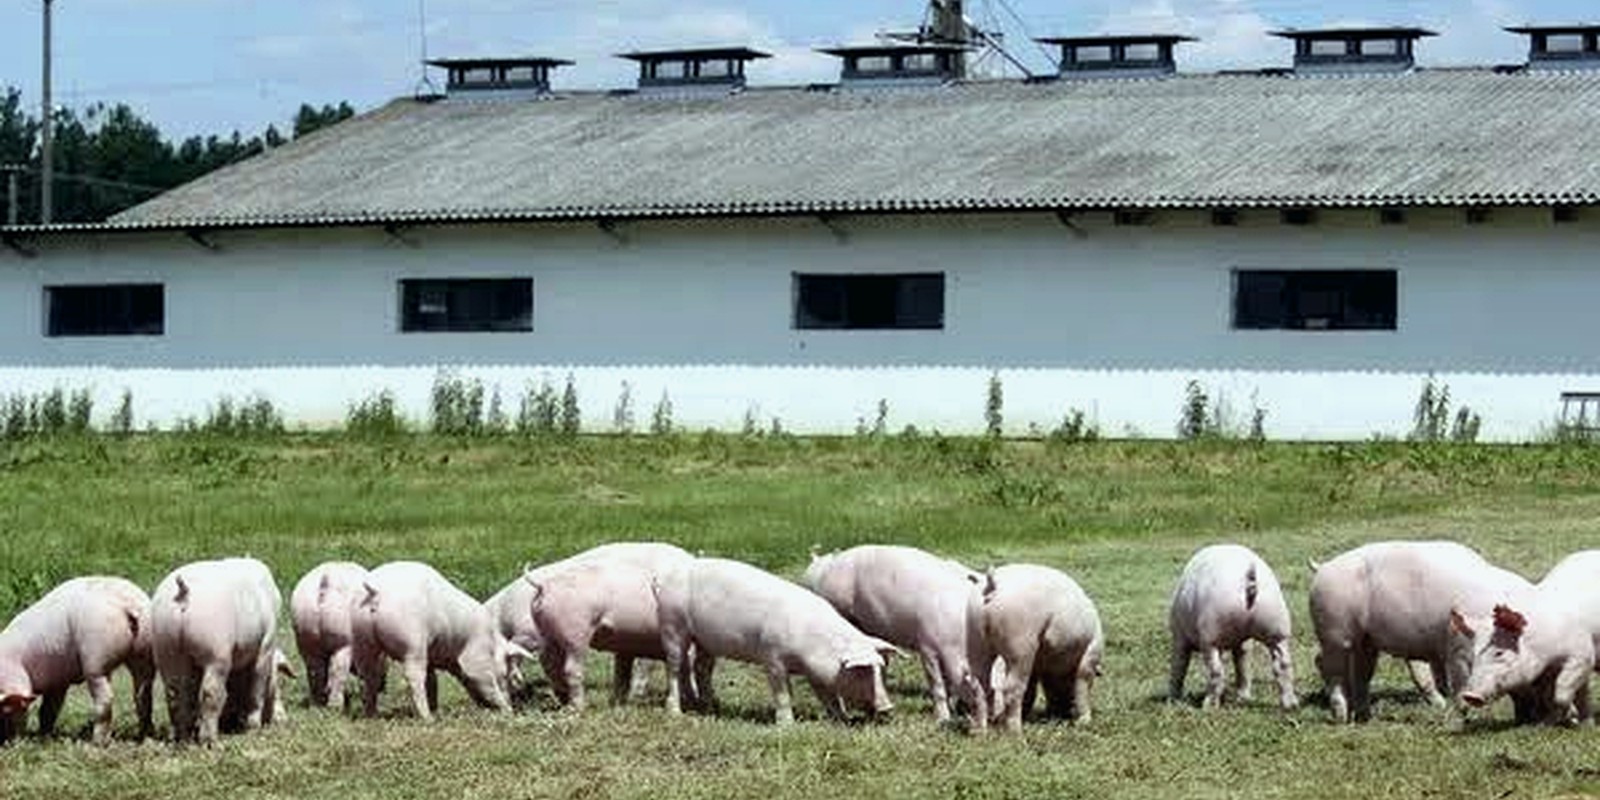
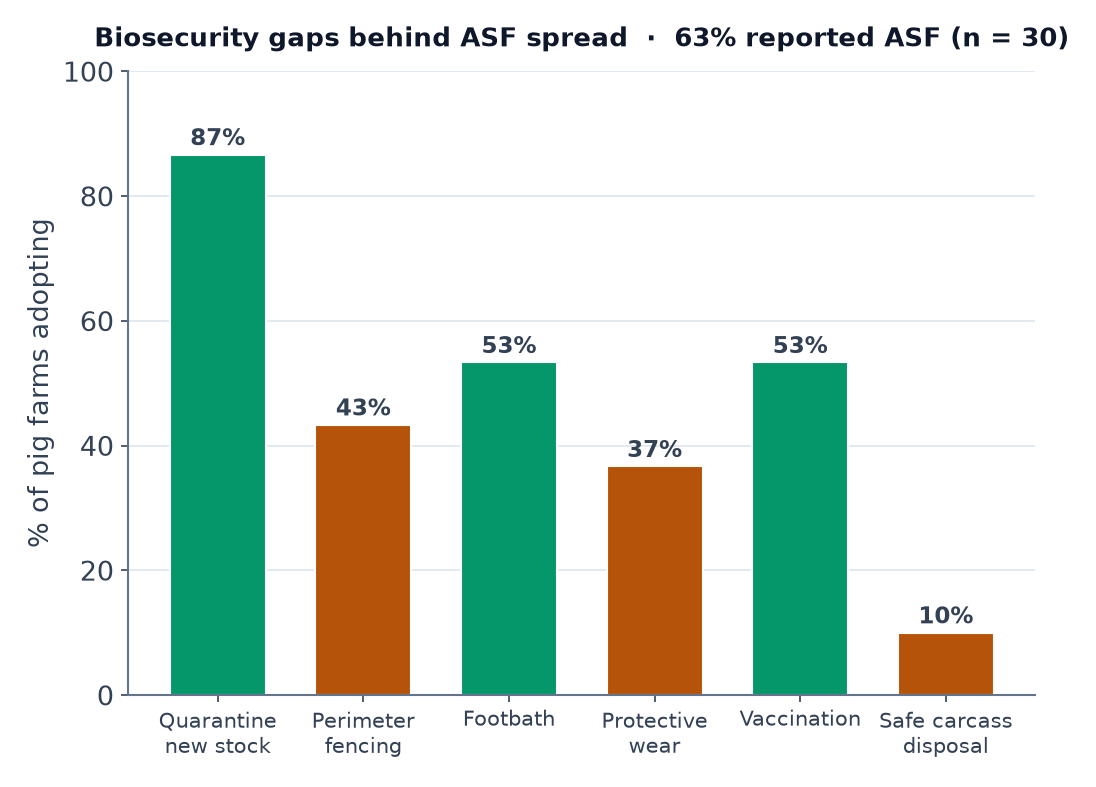
04Smallholder pigs of the kind surveyed for African Swine Fever impact (representative photo).Adoption of key on-farm biosecurity practices — the gaps that let African Swine Fever spread (n = 30).
Veterinary epidemiology — swine disease surveillance and farm biosecurity
Quantifying the Income Impact of African Swine Fever on Smallholder Pig Farms
Goal — prove and quantify the income impact of swine disease
A questionnaire survey of 30 smallholder pig farmers in a peri-urban municipality of the Bamenda highlands (North-West Cameroon) examined common pig diseases and their effect on farmers' income. Farms were experienced (mean 8.4 years) and mostly intensive (83%), averaging about 15 pigs each.
The problem
The study needed to identify which diseases drive losses and to test rigorously whether disease outbreaks are statistically linked to reduced farm profitability, despite a modest sample and no laboratory confirmation.
What I did
Survey responses were summarised with frequency tables and 25 charts across demographics, disease burden, biosecurity, veterinary practice and socio-economics, then a 2x2 Chi-square test of independence (with Yates' continuity correction) related outbreak occurrence to perceived profitability.
African Swine Fever was the most reported disease (40%), with 63% of farms ever affected; the Chi-square test confirmed a significant link between outbreaks and lower profitability (chi2 = 4.367, p = 0.0366), with 14 of 17 outbreak-hit farms judged less profitable.
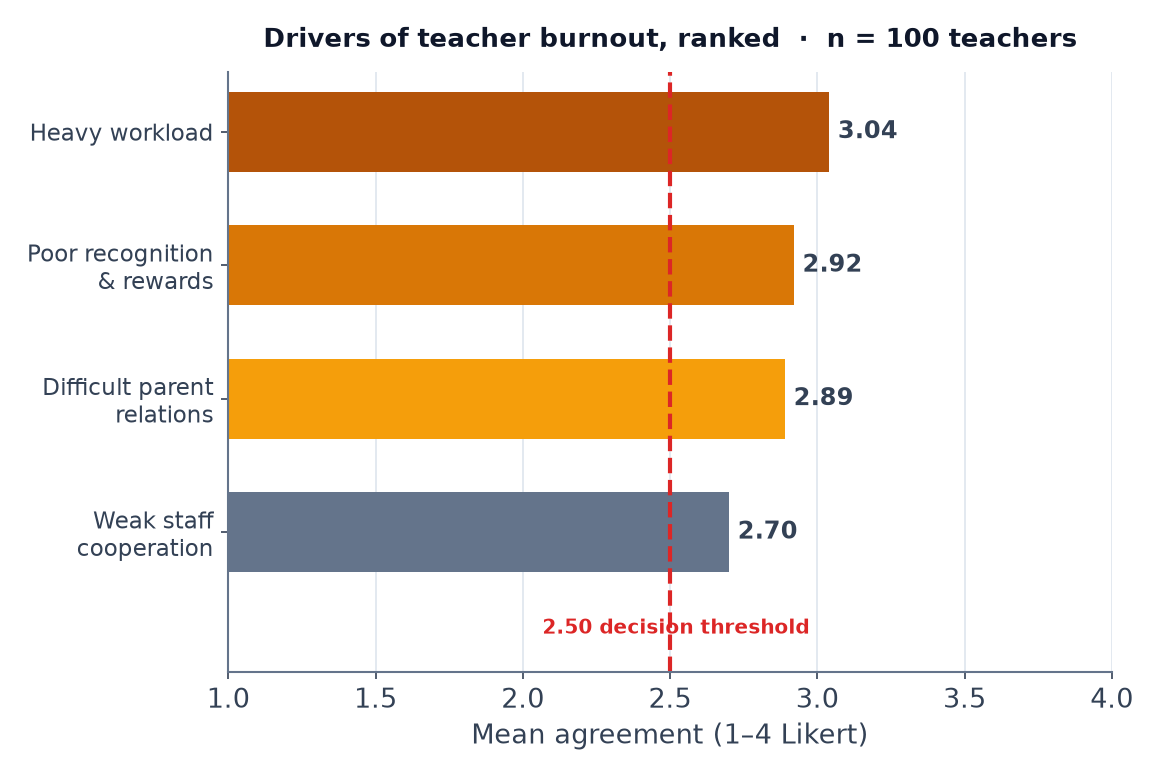
05A primary-school classroom — the setting behind the teacher-burnout survey (representative photo).Four institutional burnout drivers ranked by mean agreement; all clear the 2.50 threshold (n = 100).
Education / educational management — teacher wellbeing and burnout research
Quantifying the Institutional Drivers of Teacher Burnout in Private Primary Schools
Goal — turn mixed-methods burnout data into ranked, defensible evidence
A master's dissertation in educational psychology examined how four workplace challenges drive burnout among private primary school teachers in an urban division of North-West Cameroon, a sector with weak welfare protection and acute crisis-related strain.
The problem
The analyst needed to turn mixed-methods survey and interview data into defensible statistics — testing four hypotheses and ranking the relative weight of each challenge — while resolving a sample-size inconsistency (one summary table reported N=100 against N=107 analysed elsewhere).
What I did
In SPSS 26, each of the four challenges was tested against teacher burnout with Pearson correlation and simple linear regression at p < .05, then triangulated against thematically coded administrator interviews; descriptive item means were read against a 2.5 decision criterion on a four-point Likert scale.
All four challenges were significant positive predictors of burnout (p < .001); poor recognition and rewards was the strongest single driver (r = 0.593, R² = .352), while heavy workload was the most widespread (75.1% agreement, mean 3.04), giving proprietors a ranked, evidence-based order for welfare interventions.
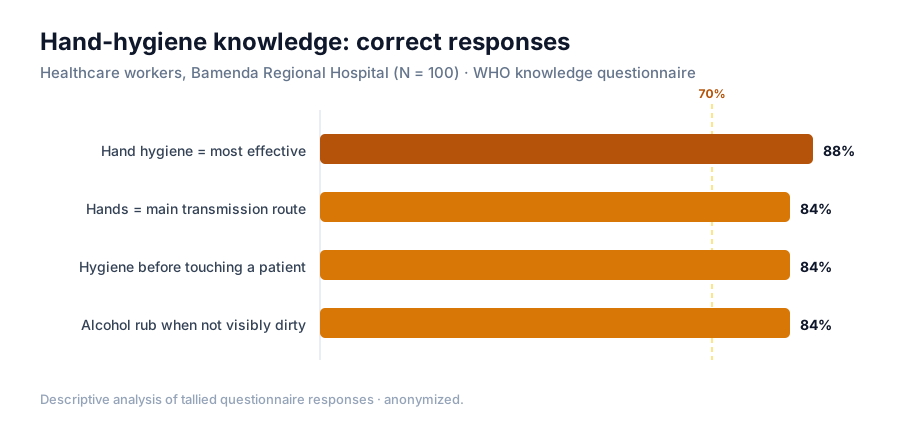
06Hand hygiene in a hospital setting — infection prevention among healthcare workers (representative photo).Correct responses on key hand-hygiene knowledge items (N = 100).
Public health / nursing — infection prevention and control
Hand-hygiene adherence among hospital healthcare workers
Goal — measure hand-hygiene knowledge, adherence and the barriers behind it
A descriptive cross-sectional nursing study at a regional referral hospital in North-West Cameroon assessed hand-hygiene knowledge, adherence and barriers among healthcare workers, using the World Health Organization Hand Hygiene Knowledge and Perception questionnaire.
The problem
Hand hygiene is the single most effective measure against healthcare-associated infections, yet adherence among healthcare workers is often suboptimal in low-resource settings — and a pile of raw questionnaire responses had to become a clear picture of knowledge, practice and the obstacles to compliance.
What I did
I tallied and analysed 100 questionnaire responses across socio-demographics, knowledge items, adherence and barriers, building frequency tables and charts (knowledge-correctness, professional mix, experience) and reading them against the WHO 'My Five Moments for Hand Hygiene' expectations.
100
Healthcare workers surveyed
78%
Female respondents
88%
Knew hand hygiene is most effective
WHO tool
Knowledge & perception questionnaire
nursinginfection preventionsurvey analysisdescriptive statisticsWHO questionnairepublic health
Result
The analysis showed strong baseline knowledge — 88% identified hand hygiene as the most effective measure and 84% the correct moments to perform it — while isolating where adherence and resources fall short, giving the hospital an evidence base to target hand-hygiene promotion.
➕
And many more projects to discover
These are only a sample of the dissertations and analyses I have supported — across animal science, veterinary medicine, public health, nursing and education. The full list is longer, and yours could be next.